All you need to know about your products!

| 3DNews Vendor Reference English Resource - All you need to know about your products! |
||||||
 |
||||||
|
|
||||||
CPU-boundedness of the video system Transition range. "Critical" point of the CPU clock speedAuthor:Date: 26/03/2008 BackgroundQuite a lot of time has passed since the time the first review of CPU-boundedness of the video system was published. That time, we found out that while the video system performance is more than enough, the test results in FPS are almost linear-dependent on the CPU clock speed. On the contrary, while the power of the video cards is insufficient, the graph of results starting from a certain point moves along a horizontal "shelf" and is almost independent of the CPU clock speed. There is one point though which was omitted that time and since then has been haunting. To illustrate what precisely we mean, let's bring in one of the graphs of the previous article.  As you can see, the line of results for the 1024õ768 No AA/AF mode goes very close to the slanted blue line that illustrates the linear dependence on the CPU clock speed. To fix the idea, we'll refer to this section of the "FPS vs. CPU clock speed" dependence as a linear section. The second important part of the graph is the horizontal "shelf" which you can see in the right-hand part of the graph, on the example of the line for the 1600x1200 4AA/16AF mode. As you can see, transition between these extreme states goes smoothly, without sharp bends. That is well seen on the lines of results for the 1600õ1200 No AA/AF and 1280õ1024 4AA/16AF modes. We'll refer to the region between the linear and horizontal parts of the graph as the "transition region". Where does it come from? Why can we see a smooth bend of lines and not a sharp bend? What is the cause of that? Let's try to find the answers to these questions. Preliminary NotesAs the experience suggests, whatever video card you take, whatever test-bench and whatever modes you use to run tests – in most cases the graph of dependence of the average FPS on the CPU clock speed will always have the three regions – linear, transition, and horizontal. Certainly, in some cases some of the mentioned regions may be not so explicit. For instance, if the video card does not bound the system performance, then we get an FPS dependence on the CPU clock speed close to linear. On the contrary, if the video card is "weak" and the CPU is powerful enough, the graph of FPS dependence on the CPU clock speed degenerates into a horizontal line. In fact, these two extremes are frequent options of the generic case mentioned above. Why does the graph of dependence on the average FPS on the CPU clock speed take such a "classical" form? To answer this question, let's take a detailed look at the source data it is built upon. If you read the previous articles of this series, the method for producing this data must be familiar to you. We'll be using the data on the time taken to render each frame produced by the FRAPS utility as it was described in Methodology for testing video cards: 2007. Use of FRAPS.. The test bench according to modern standards is no among the powerful but is sufficient to demonstrate all the key ideas and reveal the required regularities.
We'll be using the game F.E.A.R. as the test application. The findings that we produce are easily applicable to any other game. OK, off we go. 
Figure 1
As before, the graph of FPS dependence on the CPU clock speed was built through a downward adjustment of the CPU multiplier, with the remaining settings left unchanged. The average FPS produced at each CPU clock speed are plotted on the graph. As you can see, for the selected graphic mode the graphs takes the form close to the classical, albeit is not fully "ideal". Further reasoning may seem somehow verbose but it is important for the root of the matter. Later, we'll back it with graphs and diagrams. What is the average FPS? By definition, it is the number of played frames in a demo scene divided by the duration of the demo scene. The dimension of the value is "1/sec". If we take a frame and divide the unity by the time for rendering this only frame, then we produce a quantity of the same dimension as that of the average FPS. Let's call the produced quantity the "instant FPS" which corresponds to this particular frame. That is, if a frame was rendered during 20 milliseconds, then the "instant FPS" for this frame will be 1/0.02 sec = 50 FPS. Why are we going deep into this maze? Here is why. Clearly, the average FPS will be the higher the less is the time taken to render a scene, that is less time taken to render each frame. Or, in other words, the higher is the part of frames with high instant FPS. What does the time take to render each frame depend on? It may seem that the answer is evident – it depends on how fast a video card draws the frame. But what happens if the video card, roughly speaking, is capable of drawing frames too fast? At some moment, it would have to wait until the new data from the CPU is fetched. If we take a faster CPU, then rendering each frame in this situation will run faster, and vice versa. That is, the speed of the CPU in a certain way affects the time taken to render a frame, but how substantial the contribution to the resultant FPS is and under what conditions - still hard to say. Let's move to a demonstration. 
Figure 2
This is a diagram of distribution of instant FPS values for a CPU of 2700 MHz clock speed. This diagram is built in the following way. We take the time take to render each frame and based on that we calculate the instant FPS and then count the number of instant FPS values within a certain range. In our case, the selected FPS range was equal to unity. The height of each bar on the diagram just shows how many instant FPS values of all the demo scene fit within each range. On the diagram, we also drew a vertical line that denotes the average FPS. As you can see, the scatter of instant FPS values is very high – within 35 to 300. However, most part of the values is concentrated in the left-hand part of the diagram. What happens if we reduce the CPU clock speed? In principle, the calculation of frames this time should run a bit slower. But most of all, that should affect those frames whose instant FPS is close to the maximum. Using the distribution diagram shown in Figure 2, let's try to build a graph of average FPS values, similar to graph 1, with an important exception – step by step, we'll discard all the values of instant FPS which are greater than some level, that is, we'll not include them into the calculation of the average FPS. You can see what comes of it on the below figure. 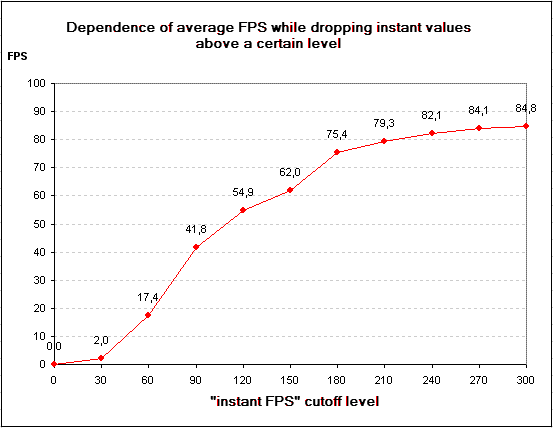
Figure 3
Here, the "cutoff level" is plotted over the Õ axis instead of the CPU clock speed. Clearly, the graph is artificial by construction. Moreover, the method of discarding the "instant FPS" directly affects the value of the average FPS calculated in this way. Let me explain why. You can simply discard some frames thus leaving the total time taken to render a demo scene unchanged. It is also possible to deduct the time spent for drawing frames together with the dropped frames from the total rendering time. There arises the question - which of the methods is more reliable? In reality, as the GPU frequency goes down, the "fast" frames do not disappear - they are simply rendered for a longer time. On the other hand, the total rendering time goes up, which should also taken into account. Anyway, we are not going deep into these details right now. We can build our "imaginary" graph in any way we like (for certainty, we note that we have used the first of the above mentioned methods). We will soon find out how precisely it correlates to reality. As regards the transition region, the cause of its origin becomes clear on the example of building this graph. If we gradually increase the power of the CPU (for instance, through raising its clock speed), the part of frames whose instant FPS is high also goes up, therefore the average FPS is also going up. However, continued growth of the CPU clock speed results in that the video card becomes the major constraint. Therefore, the pace of growth of the "fast frames" is going down. As soon as the capabilities of the video card have been revealed to the full and it is no longer able getting an FPS that is over its limit, increase in the CPU clock speed does not affect the gain in the average FPS at all, so in the end we get the horizontal "shelf" on the graph of the average FPS dependence on the CPU clock speed. The real pictureIn addition to Figure 2, we'll build a few more diagrams for the distribution of instant FPS values depending on the real clock speed of the CPU. 
Figure 4
There are some changes in the distribution pattern, albeit far unobvious. OK. Going on. We reduce the CPU multiplier (and therefore its clock speed) by one more increment. 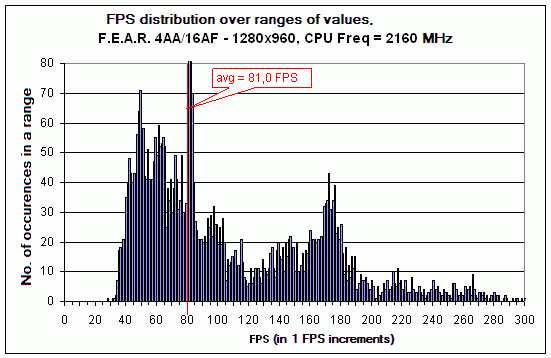
Figure 5
Here, we can more vividly see that the density of values in the right-hand part of the diagram is much lower than in Figure 2. At the same time, the remaining part of the diagram has not undergone quality changes, and the average FPS remains almost the same. 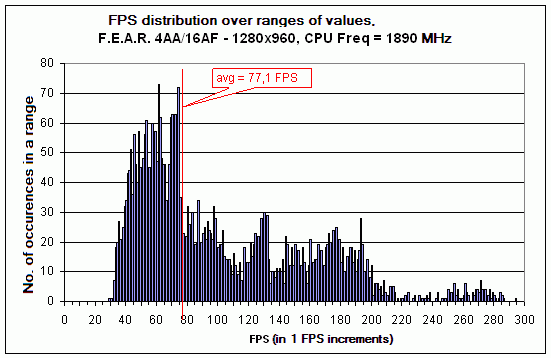
Figure 6
As you can see, with the reduction in CPU clock speed the bars move increasingly to the left. That is, the part of frames with the low rendering time (high instant FPS) is going down. At the same time, the jump in the value of the average FPS becomes more visible. Note the leftmost bars in the distribution diagram. In fact, it is the minimum FPS which we can observe in the demo scene. If we compare it to the values on the previous diagrams, we can see that despite the almost 1.5-fold reduction in the CPU clock speed the minimum FPS is still at the level about 35 FPS. That is, change in the CPU clock speed does not affect the time taken to render the "slowest" frames, therefore it is fully determined by the "power" of the video card. Will the situation like that preserve further on? As the simple logic suggests, sooner or later the reduction in CPU clock speed should affect the value of the minimum FPS as well. In the limit case when the CPU clock speed equals 0 MHz, we won't be able to produce a single rendered frame at all, that is, both the maximum and the minimum FPS will equal zero. We reduce the CPU clock speed by another increment. 
Figure 7
As you can see, the diagram vividly shifts to the right. Only the frames with the instant FPS greater than 270 vanish, with the "major bell" of the distribution shifting to the left. The maximum FPS already equals 35 and not 30. Let's look further. 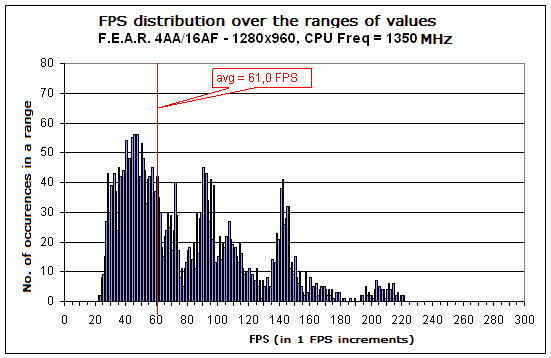
Figure 8
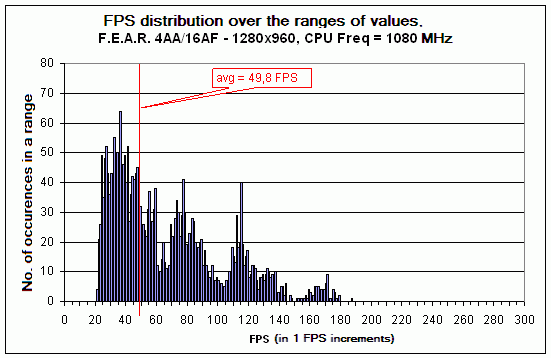
Figure 9
The trend preserves. The share of frames with the values of instant FPS greater than 150 is negligible. At the same time, the minimum FPS amounts to merely 20 FPS. Therefore, it turns out in reality that with the reduction in CPU clock speed the FPS not only "shrinks" due to the vanished "fast" frames (or, frames of high instant FPS value) but it also shifts to the left over the X axis. That is somehow different from our assumptions which we proceeded from while building the artificial graph in Figure 3. Nevertheless, let's try aligning the real and artificial graphs in order to estimate the rate of discrepancies between the theory and reality. 
Figure 10
We added the real values of the average FPS from graph 1 to the graph in Figure 3Ê. In so doing, we tried to align both the graphs as much as possible. Since the maximum FPS values in these two graphs are the same, it sufficed to change the scale of graph 1 over the axis Õ (the origins of coordinates on both the graphs coincide). As you can see, despite all the assumptions and estimates, the graphs are well enough matching relative to one another. What practical findings can be inferred from all this reasoning? Like these, for instance… As can be seen from the just presented example of aligning the graphs, if we need to produce a graph of dependence of the average FPS on the CPU clock speed, we don't have to measure the average FPS for each value of the CPU clock speed - that suffices for the CPU maximum clock speed (where the FPS values emerge onto the horizontal "shelf") and for the minimum possible CPU clock speed where the average FPS is already at the linear section. Then, through the above manipulations with discarding the "fast" frames we can produce an artificial graph, so the only thing left to do is to match it with the points that correspond to the measured values of the average FPS. How universal this approach is and how applicable it is to all graphs like these is a matter of a separate investigation. However, if this approach proves right, testers could save quite a fair amount of time and produce exhaustive information on the behavior of the average FPS at various CPU clock speeds. There is also a good news for the regular users as well. Quite often, in the letters that arrive to our editorial board and on our forum, they raise the question – "Which CPU will be capable of coping with a certain video card?" Such a problem statement is not quite correct. If the CPU is weak, the video card will not stop "displaying", nor it will operate worse. It would be more appropriate to put it like "what processor is able revealing the capabilities of a specific video card to the best?" Now we can answer this question. Of course, we don't mean that we can specify the minimum required CPU for each specific video card right now (perhaps, with time there will be such statistic on the web site). Now we know the criterion of "sufficiency" for the CPU. As was shown above, with the decrease of the CPU clock speed to a certain value, the level of the minimum FPS starts moving and decreasing. Such a value of the CPU clock speed can be referred to as "critical". At CPU clock speeds lower than the "critical" the minimum FPS starts falling essentially, that is, the gameplay turns less comfortable. At CPU clock speeds above the "critical" value, the average FPS may be greater, but its gain is achieved through an increase in the number of "fast" frames, which has little effect on the comfort of the gameplay since the "major bell" of FPS distribution remains at its former point. If there isn't much need in a special precision, the "critical" CPU clock speed can be determined in even a simpler way - when the graph of the average FPS is going to take the form of a horizontal shelf, this is just the "critical" clock speed of the CPU. In our example, for this particular test bench and the selected graphic mode it turns out that for a comfortable gaming experience in F.E.A.R. it suffices to use an Athlon 64 X2 with the clock speed about 1900 MHz (Athlon 64 X2 3800+). Similar reasoning can be made for any other computer, game, or a graphic mode. Take, for instance, the Crysis game. The hit of autumn 2007 is a serious load for any modern computer. Needless to say, the test configuration is a bit too weak but the general principles hold true here as well. We used the test of the video system integrated into the game. Below is the graph of the average FPS for the 1024õ768 No AA/AF mode. 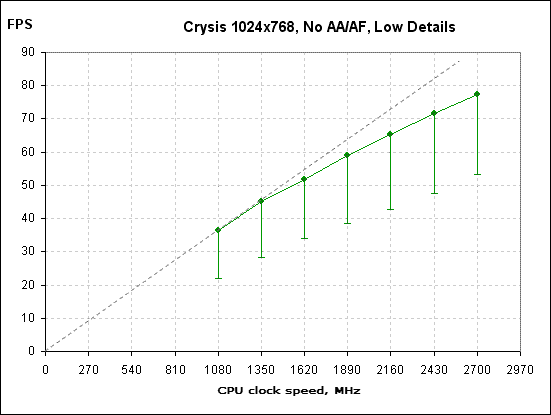
Figure 11
As you can see, in this case we observe a linear section (coincides with the dotted straight line from the origin of coordinates) and the transient region. There is no horizontal shelf, since the margin of CPU clock speed for this game in this mode has proved to be insufficient. The dots mark the values of the average FPS, with the dashes below corresponding to the values of the minimum FPS. The presented graph is far from tending to the horizontal shelf in the right-hand part. On the other hand, if the minimum FPS at about 40 is sufficient for you, then even on this computer with such graphic settings you can enjoy a comfortable gaming experience at CPU clock speeds about 2000 MHz. If we increase the display resolution to 1280õ1024, then we get a similar graph which coincides with the previous in the left-hand part but makes an essential difference in the right-hand part. 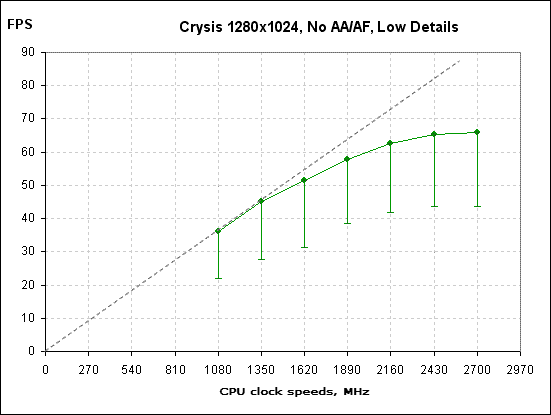
Figure 12
Just look - now the extreme left dots form a horizontal "shelf". This suggests that the video card has reached its capability limit and even with the increase in the CPU clock speed is not able drawing frames at a greater speed. Nevertheless, for this resolution as well the "critical" CPU clock speed remained the same – about 2000 MHz. 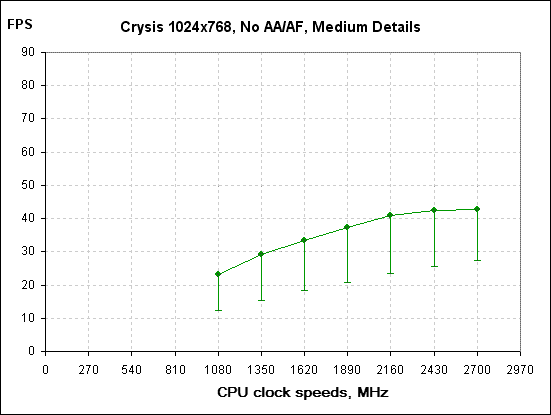
Figure 13
With the graphic quality set to "medium details", the picture changes dramatically. The FPS goes down substantially because the video card is definitely weak. That is seen from the horizontal "shelf" in the right-hand part. However, if we follow the deduced criterion, the "critical" CPU clock speed amounts to about 2000 MHz. At the same time, the minimum FPS is at a level about 20, which is quite low. In fact, you can't call the average FPS at 40 comfortable for a "shooter". The conclusion is straightforward. For this regime, the CPU is sufficient, while the video card is weak. ConclusionThe graph of dependence of the average FPS on the CPU clock speed has repeatedly given us food for thought. In the first part of the review, we deduced the "criterion of correct comparison of the video card performance", according to which for different video cards it is correct to compare those values of the average FPS which lie on the horizontal "shelf" of the graph. However, this criterion is more likely suitable for testers to produce correct results of comparison. This time, we examined the other sector of the graph – the transient region between the sector of the linear growth and the horizontal "shelf". The results produced in this review offer an explicitly practical bias and may be of use for most users. I mean the "critical clock speed" of the CPU which determines the minimum performance required to a CPU which is able revealing the most capabilities of the video card. Using this methodology, everybody can determine how balanced the PC configuration is, and how the CPU reveals the capability of the video card, or if it is the right time for upgrade. Or, maybe the time has come to fit a new video card and not the CPU.
- Discuss the material in the conference
|
|
|||||